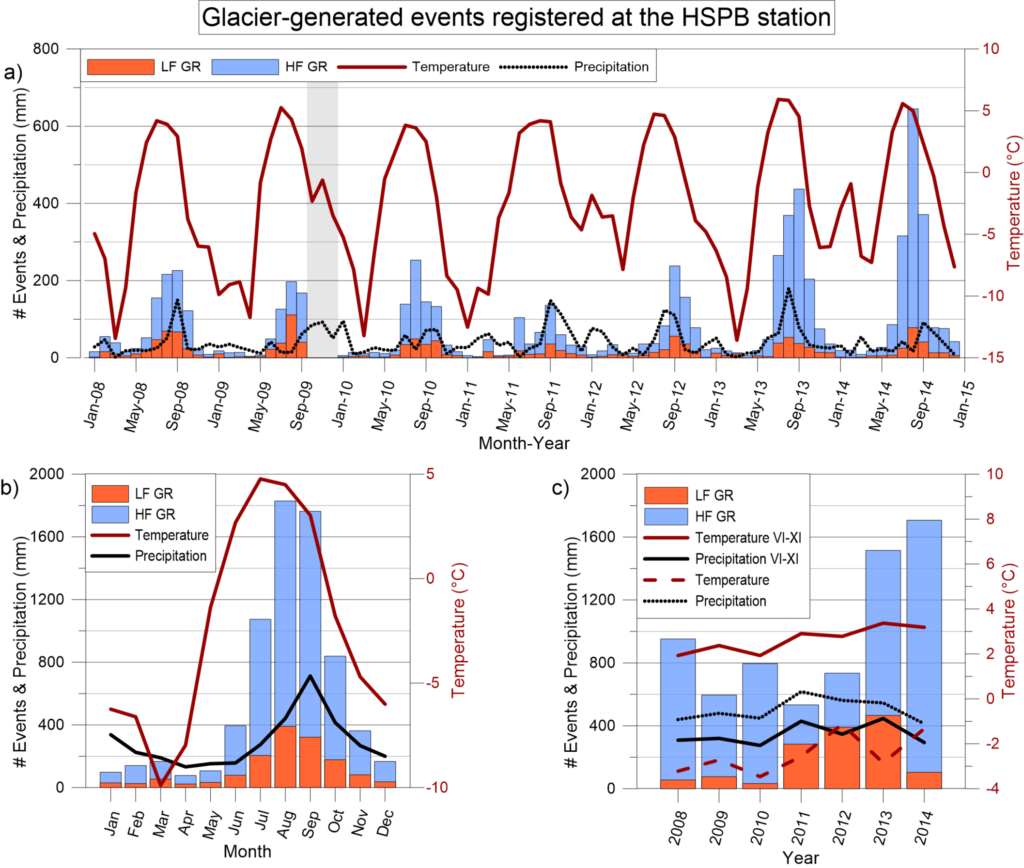
Temporal distribution of ‘glacier-induced’ events from the HSPB station. ‘Low-frequency glacier-related’ marked in orange, ‘Highfrequency glacier-related’ marked in blue and plotted on top of ‘LFGR’ (a) 1 month step distribution with the mean monthly temperature – red solid line, and summed monthly precipitation – black dotted line, a data gap is indicated by the shaded rectangle; (b) monthly distribution of all events summed over 2008–2014, with summed precipitation – black solid line, and mean temperature in each month over 2008–2014 – red solid line; and (c) distribution of all events between 2008 and 2014, with the mean temperature in warm months (VI-XI) – red solid line, the summed precipitation in warm months (VI-XI) – black solid line, whole year mean temperature – red dashed line and whole year summed precipitation – black dotted line.
Glaciers are dynamic systems that are in constant motion. Their movement, changes in their stress regime, cracks and crevasse expansion, iceberg calving and ice-basal friction all release energy, which can release detectable seismic signals.
Our research focuses on glaciers located in Hornsund, southern Spitsbergen, in the vicinity of Polish Polar Station, with special interest in Hans glacier.
We developed an automatic procedure capable of detecting glacier-induced seismic events using records from a single permanent seismological station located nearby Hans glacier. To distinguish between glacial and non-glacial signals, We developed a fuzzy logic algorithm based on the signal frequency and energy flow analysis.
The paper presenting 7-years long glacier activity analysis is available on-line HERE.
In September 2017 We have installed a seismic monitoring network around the Hans glacier calving cliff. The network have been recording permanently till May 2018. The data is being processed right now and is available online HERE. More on that topic can be find in Seismology chapter of SESS 2019 report and in project log. The project is carried by Wojciech Gajek and coworkers, financed by an internal grant of Institute of Geophysics Polish Academy of Sciences.
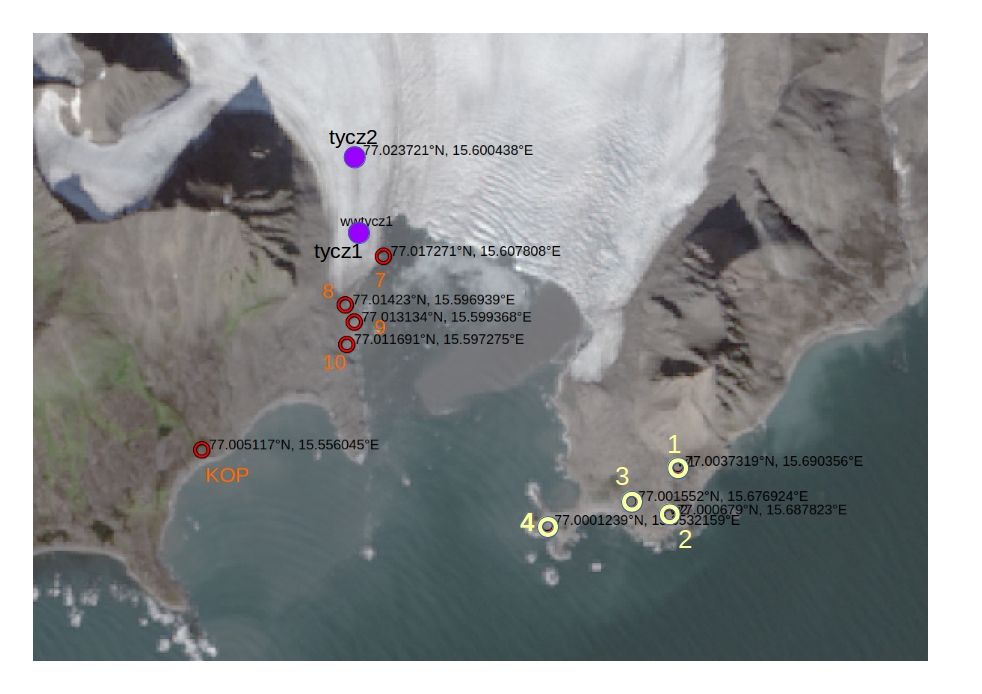
A map of temporal seismic network and Hans glacier terminus. Station installed on rocks are marked with cirles, station installed on glacier are marked with dots.
In a summer of 2021 we revisited the Hans glacier with an international group of scientists. Our goal was to investigate the dynamics of Hansbreen’s calving front. The field campaign lasted almost 10 days. The video featuring our fieldwork is here. We monitored the calving front using 2 small seismic arrays aided by time-lapse remote sensing observations from a millimetre-wave radar (AVTIS2), Terrestrial Laser Scanner and cameras.
We work towards linking ice volumes derived from radar scans with parameters of seismic signal in order to be able to track calving-related volumetric ice loss remotely in a long-term manner.
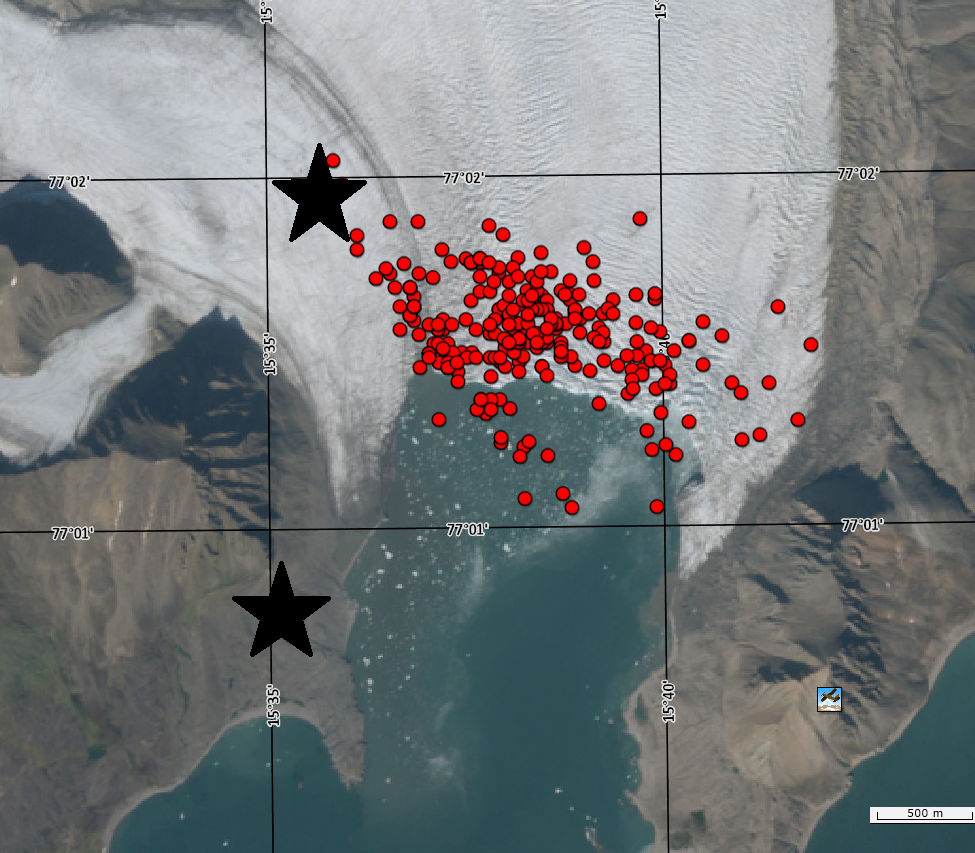
Locations of 260 calving-style seismic events (red dots) obtained using records from 2 seismic arrays (black stars) within 8 days between 26.7-2.8.2021. Detection algorithm was tuned based on calving events observed on-site.
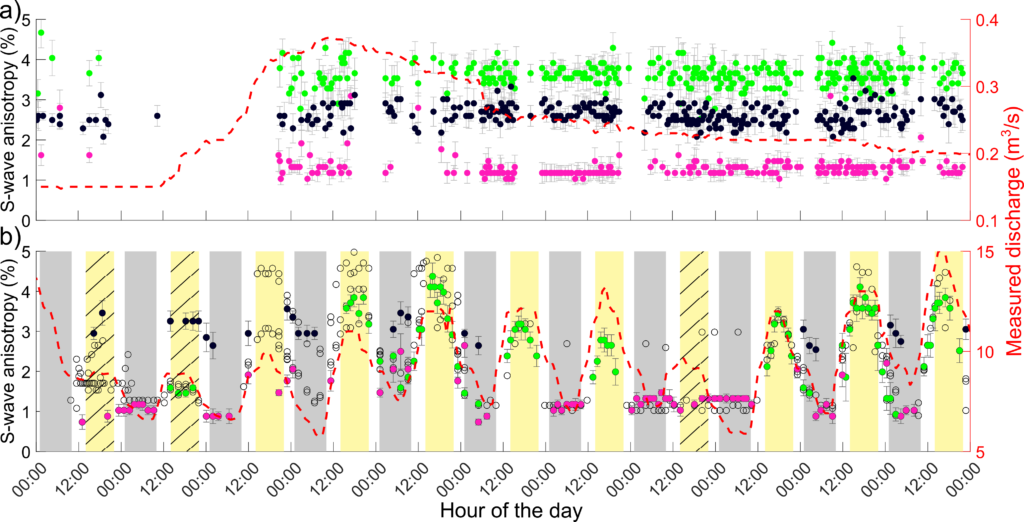
a, b 11-day long time series of shear wave anisotropy magnitude with 95% confidence interval (coloured dots with grey uncertainty bars, respectively) and meltwater discharge (red dashed line) measured during winter (a) and summer (b). a 11-day long time series starting on 10 March 2018. b Time series starting on 21 July 2018. Colours of dots represent different icequake cluster-seismometer pairs (i.e., different raypaths).
Glacial ice is also anisotropic due to ice crystals alignment and spatially organised different scale discontinuities (from micro-cracks to crevasses).