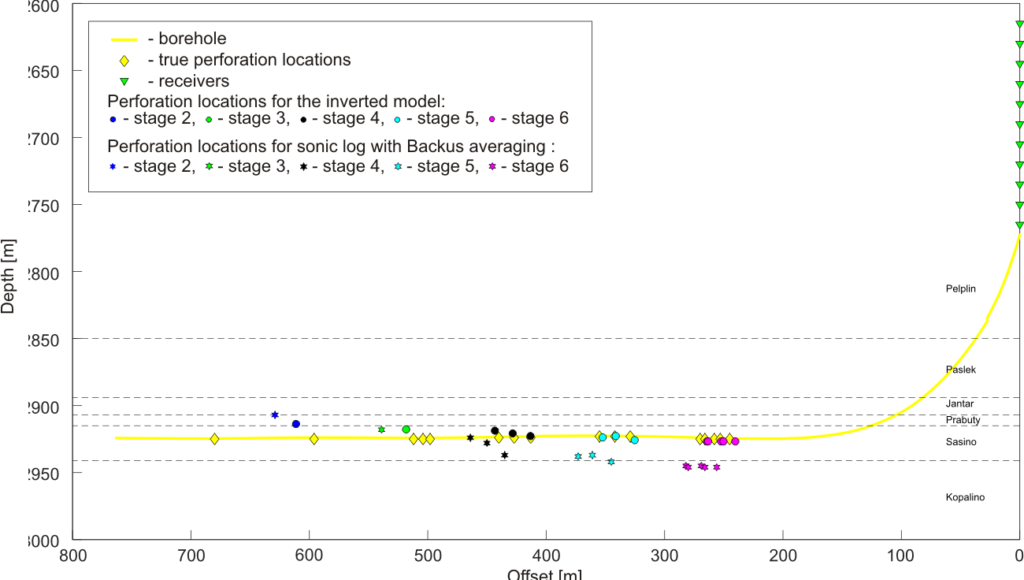
Perforation shots locations in a vertical cross section aligned with borehole trajectory. True locations perforation shots are marked with yellow diamonds. 13 perforation shots visible in microseismic data located using Backus averaged well-log based model are marked with stage-coloured stars. Perforation shots relocated using a 5 layer anisotropic model inverted using my approach are marked with stage-colored circles.
In order to obtain proper microseismic event locations an accurate velocity model is necessary. Due to internal structure of shales and fractures seismic velocities depend on the incidence angle, and hence anisotropy needs to be taken into account when inverting for the velocity model. Following figure shows how accurate can we calibrate the velocity model when accounting for anisotropy.
A paper discussing ignoring the effect of anisotropy in a borehole setting is available here.
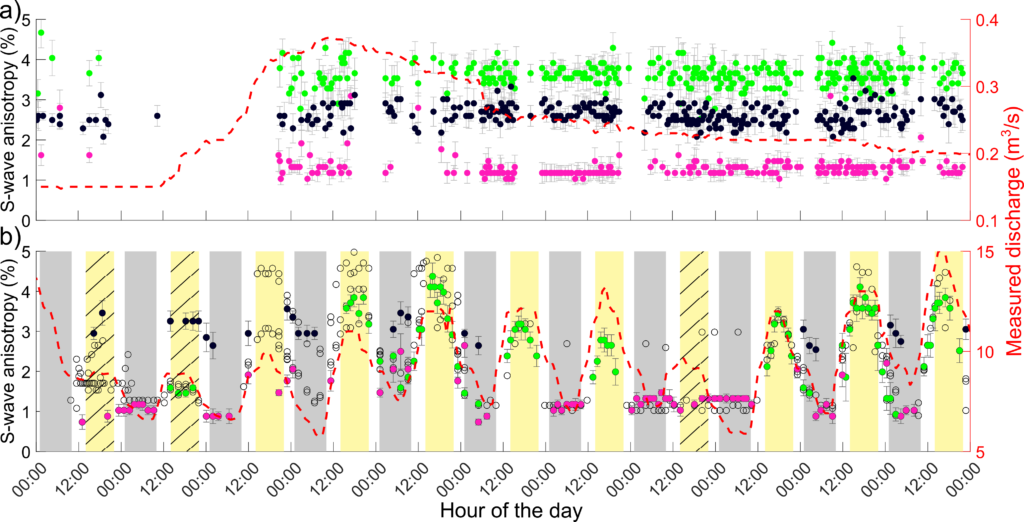
a, b 11-day long time series of shear wave anisotropy magnitude with 95% confidence interval (coloured dots with grey uncertainty bars, respectively) and meltwater discharge (red dashed line) measured during winter (a) and summer (b). a 11-day long time series starting on 10 March 2018. b Time series starting on 21 July 2018. Colours of dots represent different icequake cluster-seismometer pairs (i.e., different raypaths).
Glacial ice is also anisotropic due to ice crystals alignment and spatially organised different scale discontinuities (from micro-cracks to crevasses).